Kindly open the website on a laptop or desktop, as the mobile version is currently under construction.

Can Social Media Predict Stock Markets? Deep-diving into Multi-Modal Stock Prediction
Mohar Chaudhuri
12/3/202521 min read
This project tests whether integrating alternative data with traditional financial metrics improves prediction and provides early warnings for market events. We analyzed 52 stocks (2015-2024) using 154 features spanning price data, fundamentals, earnings sentiment (FinBERT), and social media. Multi-modal models achieved AUC 0.523 versus 0.514 baseline (+1.7%), with alternative data contributing 15% of predictive power. Value varies dramatically by context: +0.5 points for large-cap stocks, +7.4 points for meme stocks. During GameStop, reddit viral posts became the #1 feature, and models detected anomalies 18 days before the peak. Surprisingly, adaptive learning underperformed static models—well-engineered dynamic features already capture regime shifts.
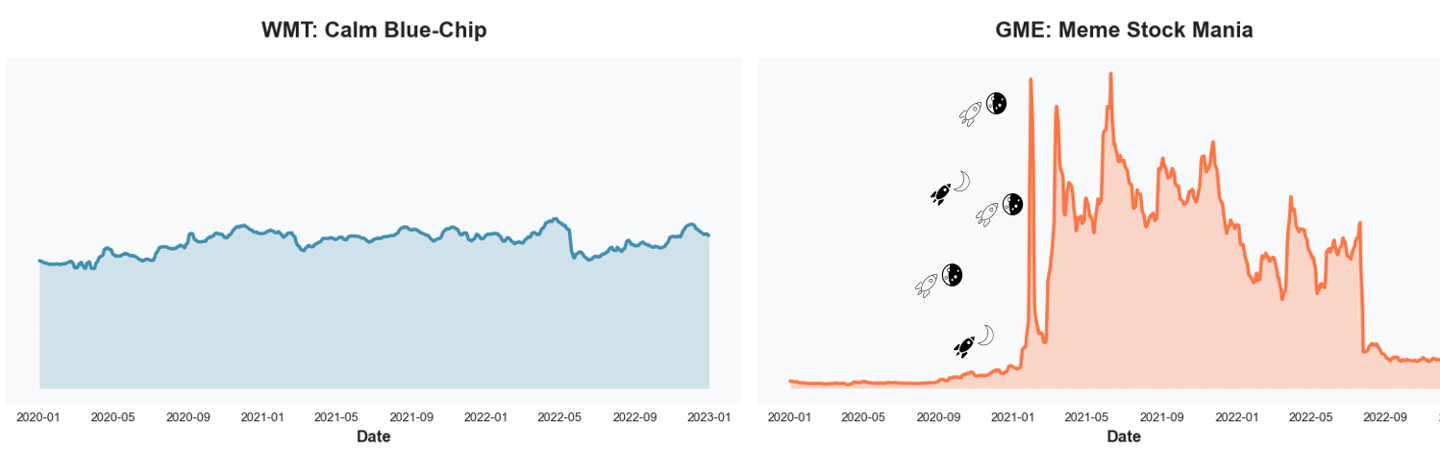
It was January 2021. GameStop—a struggling video game retailer—suddenly became the most talked-about stock in the world. The price rocketed from $20 to $483 in mere weeks. Wall Street was bewildered. Traditional models failed spectacularly. But there was a signal. On Reddit's WallStreetBets forum, activity had exploded from virtually nothing to thousands of posts daily. The coordination was visible, public, and quantifiable—yet traditional price-based models missed it entirely.
This got us thinking: What if we could quantify sentiment from earnings calls? What if we tracked social media buzz? Could integrating these "alternative data sources" with traditional financial metrics improve stock prediction?
Why This Matters?
Market Reality: Hedge funds invest millions in alternative data (market projected at $143B by 2030), yet empirical evidence on what actually works remains limited.
Retail Coordination: GameStop wasn't isolated. AMC, BB, BBBY experienced similar Reddit-driven volatility. Understanding social signals is now essential for risk management.
The Complexity Challenge: Do adaptive learning models really outperform static approaches for financial prediction, or is feature engineering more important?
In earlier studies
Twitter sentiment predicts market movements (Bollen et al., 2011; Bartov et al., 2018)
FinBERT extracts financial sentiment from text (Huang et al., 2023)
ML for asset pricing achieves ~0.54 AUC with traditional data (Gu et al., 2020)
Concept drift literature suggests adaptive models should help (Gama et al., 2014)
What's missing?
Integration of multiple alternative data sources, individual stock analysis (not just market-level), and rigorous testing of adaptive learning with real-world financial data.
Data Architecture
Stock prediction projects often stop at “we used prices and fundamentals,” but the details of how those sources are stitched together matter as much as the algorithm. Earnings come out quarterly, prices move every millisecond, social media sentiment spikes overnight, and none of it arrives neatly aligned in a pandas DataFrame.
For this project, we wanted a multi-modal view of each stock at each point in time—not just yesterday’s price, but also what the balance sheet looked like, how management sounded on the last earnings call, and whether Reddit was quietly bored or collectively losing its mind. That meant designing a data architecture that could:
The last part—avoiding look-ahead bias—is where timeline alignment becomes non-negotiable. Fundamentals for “Q1” aren’t magically known on March 31st; they’re only usable after the firm actually files its report. So in our pipeline, each weekly observation can only use fundamentals as of the report date (RDQ), and that quarter’s numbers are then carried forward into the appropriate return window.
combine daily CRSP data with quarterly Compustat fundamentals,
layer on unstructured text from earnings calls and social media, and
do all of this without cheating by using information that wasn’t actually available yet.
WRDS doesn’t give you one magical “model-ready” table. It gives you four different tables :
CRSP: daily prices and returns, keyed by permno
Compustat: quarterly fundamentals, keyed by gvkey
CCM link table: the messy bridge between permno and gvkey, with start/end dates
A historical name table: mapping each permno to the right ticker over time
To turn this into something a model can actually use, I had to build a firm–date panel in three steps.
1) Fix tickers over time
2) Attach Compustat firms to CRSP using CCM
This is where the "no look-ahead" constraint matters. For each firm (gvkey), we sorted CRSP by date and Compustat by report date (rdq), then used merge_asof with direction = "backward" so that each trading day only sees the most recent fundamentals already available. A 365-day tolerance ensures we don't use stale data.
CRSP and Compustat don't share a key, so we used the CCM link table. Each row says: "From link_start to link_end, CRSP permno = X maps to Compustat gvkey = Y." We filtered to reliable link types (LC, LU, LS, LX), merged CRSP with CCM by permno, and dropped rows where the date fell outside the link's active window (with a 30-day buffer).
Companies rename, merge, or change tickers. CRSP tracks them by permno, not ticker. We reconstructed the historical ticker series using WRDS' name history: for each permno, we matched which ticker was valid between namedt and nameenddt, then kept only rows where date fell inside that window.
3) Align fundamentals with a backward time merge
merged_g = pd.merge_asof(
crsp_g.sort_values("date"),
comp_g.sort_values("datadate"),
left_on="date",
right_on="datadate",
direction="backward",
tolerance=pd.Timedelta("365D"),
)
After looping through all gvkeys and concatenating the results, we end up with a single dataset where each row says:
“On this date, for this stock, here is the price/return from CRSP and the latest fundamentals from Compustat that the market actually knew at that time.”
Once the wiring is in place, the next question is: what actually flows through it? Each stock–day in the final panel is a snapshot that blends four different signals.
Structured Financial Data (WRDS: CRSP + Compustat)
Earnings Call Transcripts
At the core is classic market and fundamental data. From CRSP, we use daily prices, returns (including delisting returns), trading volume, shares outstanding, and market cap for our 52-stock universe (2015–2024). From Compustat, we bring in quarterly fundamentals like revenue, net income, leverage, liquidity, and cash flows. After the RDQ-aligned merge, every trading day carries the latest fundamentals the market. actually knew on that date, plus the full return history up to that point.
Numbers tell you what happened; earnings calls hint at how management feels about what happened. Using CapitalIQ transcripts via WRDS, we process quarterly calls from 2015 – 2024 and extract features such as FinBERT sentiment scores, hedging / uncertainty language, and forward-looking optimism. These are mapped to days by “filling forward” from each report date, so every trading day knows what was last said on the earnings call.
Social Media Sentiment (Reddit + Twitter)
This is the crowd layer. For 2020–2021 we incorporate r/WallStreetBets activity: post counts, comment volumes, upvote ratios, and sentiment by ticker, all extracted at the daily level. This is what lights up when a stock like GME or AMC suddenly becomes a meme. We complement it with pre-labeled financial tweet sentiment for major tickers, so each day the model sees whether the online mood is bullish, bearish, or just bored.
Employment Sentiment (Control)
Finally, we include firm-level employment sentiment from Revelio Labs as a static control variable. In our setup, this is a time-invariant score that captures the average tone of employee reviews for each company. It doesn’t react to day-to-day news or meme cycles, but it helps the model distinguish between firms that are generally well-regarded by their workforce and those that aren’t—useful background context when interpreting more volatile signals like Reddit or daily returns.
All four sources are aligned into the same firm–date panel, so when the model makes a prediction for a given trading day, it sees: how the stock is trading, how the business looks on paper, how management is talking, and how the crowd is reacting — all based only on information that was actually available at that time.
More fundamentally: When does alternative data matter, and when doesn't it?
Feature Engineering
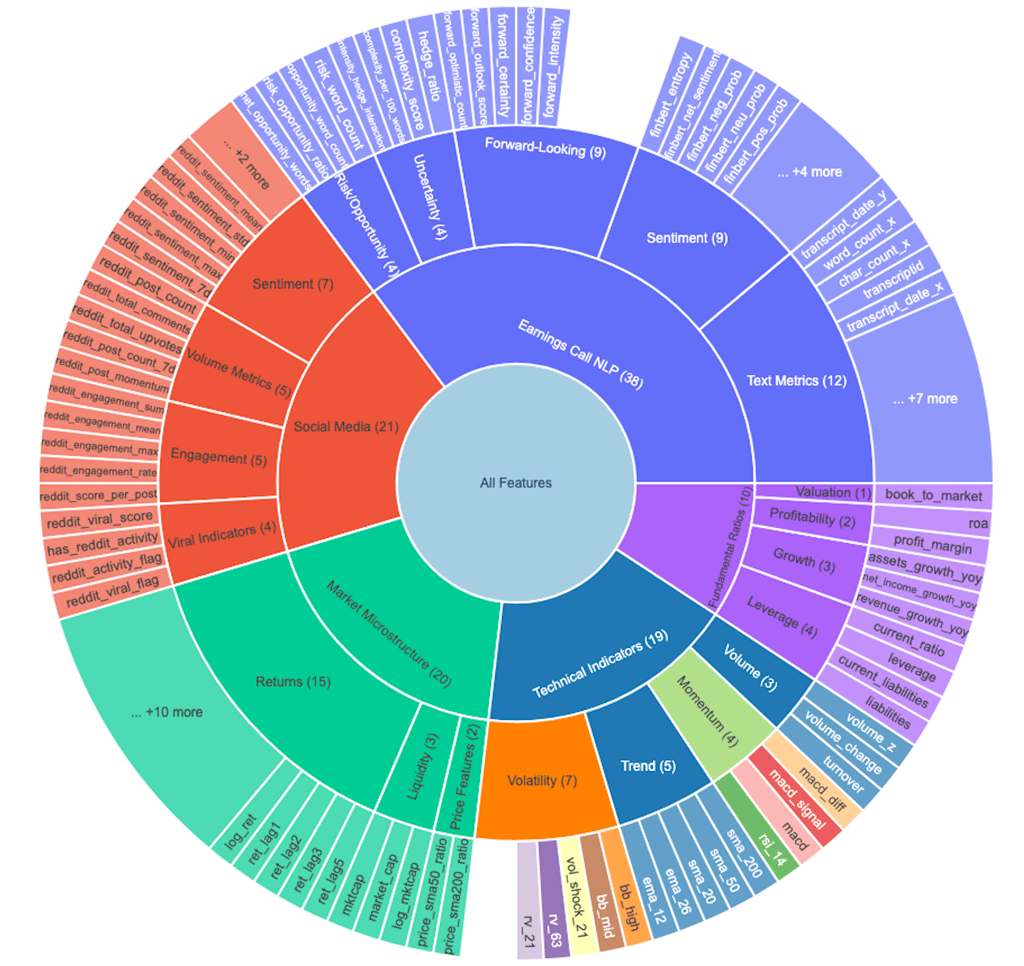
This is where the magic happens. We transformed raw data into 108 engineered features across five categories, each designed to capture a different dimension of market behavior. But rather than just building features blindly, we adopted a hypothesis-driven approach: every feature needed a clear economic rationale for why it might predict future stock movements.
The Five Pillars of Feature Engineering
1. Technical Indicators - The bread and butter of quantitative trading:
Momentum: RSI (14-day), MACD, Stochastic Oscillator
Volatility: Bollinger Bands, ATR (Average True Range), Realized Volatility
Trend: Moving averages (7, 21, 50, 200-day), EMA crossovers
Volume: On-Balance Volume (OBV), Volume Rate of Change
💡 Key insight: We calculated rolling metrics to capture changes over time, not just snapshots. For example, rather than just knowing RSI is 65, we track whether it's rising or falling, and whether it's diverging from price action.
2. Market Microstructure - Beyond price—how stocks actually trade:
Price spreads (high-low ranges)
Volume patterns (spikes, rolling averages)
Market cap dynamics
Liquidity measures
These features capture the "plumbing" of markets—patterns in how orders flow and how quickly prices adjust to new information.
3. Fundamental Ratios - Classic financial analysis meets feature engineering:
Valuation: P/E ratio, P/B ratio, EV/EBITDA
Profitability: ROE, ROA, profit margins
Leverage: Debt-to-equity, interest coverage
Growth: Revenue growth, earnings growth (YoY, QoQ)
Efficiency: Asset turnover, inventory turnover
The twist? I didn't just use quarterly snapshots. We calculated rolling changes in these metrics to detect improving or deteriorating fundamentals before they show up in prices.
4. Earnings Call NLP - Using FinBERT (a BERT model fine-tuned on financial text), we extracted:
Sentiment scores (positive/negative/neutral)
Uncertainty metrics (frequency of "might," "could," "uncertain")
Forward-looking tone (mentions of "expect," "plan," "anticipate")
Management confidence (assertiveness in language)
Change indicators (sentiment shift from prior quarter)
Demand deteriorated sharply in the final weeks of the quarter, and several key customers have postponed orders indefinitely. Rising input costs are putting additional pressure on margins, and we do not expect conditions to improve in the near term ..... We remain firmly on track to deliver our full-year targets, supported by strong customer adoption and disciplined execution across all business units. Management is confident that our roadmap positions us for sustained double-digit growth well into 2026.
sentiment_positive: 0.02
sentiment_negative: 0.96
forward_looking_count: 140
confidence_score: 0.90
Example transformation:
Management tone contains information not yet reflected in financial statements. Hedging language might signal upcoming disappointments, while confident forward-looking statements could predict outperformance.
5. Social Media Features - Capturing the Reddit revolution:
Volume metrics: Post count, comment count (7-day, 30-day)
Engagement: Upvote ratios, comment-to-post ratios
Sentiment aggregates: Mean, median, std of post sentiment
Viral indicators: Posts exceeding engagement thresholds
Velocity: Rate of change in post frequency
viral_score = (posts engagement_ratio sentiment_intensity) / baseline_activity
This captured coordination events—when a stock suddenly "goes viral" on r/wallstreetbets, often preceding dramatic price movements (as we saw with GameStop).

To validate these features and understand their predictive power, we built an interactive Streamlit app that lets us explore every dimension of the data. This wasn't just a nice-to-have—it was essential for catching data quality issues and understanding feature behavior before modeling. The dashboard spans seven views: price and volatility, technical indicators, fundamentals, NLP sentiment, social activity, earnings reactions, and a complete feature library. Together, they let us trace how markets, fundamentals, management tone, and retail attention interacted over time. The EDA app embodied a key principle: every feature needs a story. Rather than blindly engineering hundreds of features, we asked three questions for each one:
How is it constructed? (The math)
Why might it matter? (Economic intuition)
What does it predict? (Testable hypothesis)
Construction: Daily post volume divided by its 30-day moving average.
Intuition: Retail attention is usually stable; sudden spikes reflect coordinated interest or speculative surges.
Hypothesis: Extreme spikes predict near-term volatility jumps and momentum bursts, especially in sentiment-sensitive stocks.
Example: Reddit Attention Spike (Social Activity Shock)
Target Variables & Model Architecture
After engineering 108 features, the next critical question is: what are we trying to predict? This decision fundamentally shapes everything that follows—from data splitting to model selection to evaluation metrics.
THE DUAL-TASK FRAMEWORK
We framed this as both classification and regression, because they answer different questions that matter for trading.
Classification: Direction Prediction
Regression: Magnitude Prediction
Target: Tomorrow's actual return (%)
Target: Will tomorrow's return be positive?
1 = Positive return (buy signal)
0 = Negative/zero return (sell/hold signal)
Continuous value (e.g., +2.3%, -1.7%)
Useful for portfolio optimization and position sizing
Why it matters: Direction prediction is the most basic trading signal. If you can predict whether a stock will go up or down tomorrow with >50% accuracy, you have an edge. This is the foundation of any directional strategy.
Why it matters: Knowing how much a stock will move is crucial for risk management. A model that predicts +0.1% and +5.0% both as "positive" is missing critical information for capital allocation.
For this project, I focused on classification as the primary objective, since:
Direction prediction is more robust to noise
Binary outcomes are easier to validate and backtest
Most alternative data hypotheses are about information content, not precise magnitude
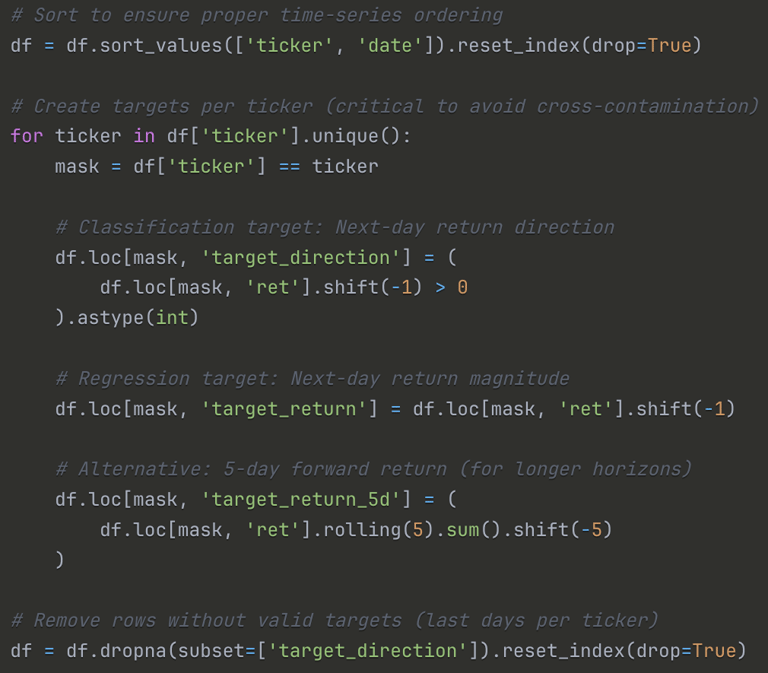
Target Variable Construction
Grouping by ticker: The .shift() operation is applied within each ticker to prevent leakage across stocks
Binary threshold: Any positive return (even +0.01%) is labeled as 1. We tested alternative thresholds (e.g., >0.5%) but found the simple >0 worked best
Forward-looking: Using shift(-1) means we're predicting the next day's outcome using today's features
The modeling dataset contains 127,200 observations and 195 total features, combining both raw financial inputs—such as prices, fundamentals, and transcript metadata—with engineered signals including technical indicators, volatility measures, NLP sentiment, and social-media activity. After constructing the final dataset, the target variable ended up almost perfectly balanced, with roughly half the observations labeled as positive and half as negative. This near 50/50 split is ideal: the model doesn’t struggle with class imbalance, and accuracy remains a meaningful metric because a naïve random guess would achieve about 50% by construction. The dataset spans 2015–2024, covers 52 tickers, and provides both a long time horizon and rich cross-sectional variation, giving the model enough structure to learn genuine predictive relationships without oversampling or reweighting.
Walk-Forward Validation: Time-Series Splitting
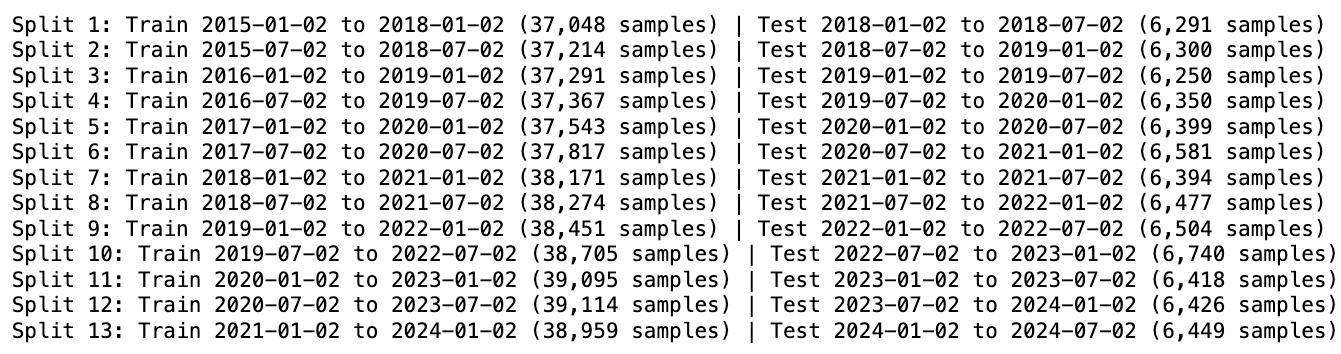
Because stock data is inherently temporal, we couldn’t rely on standard k-fold cross-validation—random shuffling would leak future information into the past. To avoid this, we used walk-forward validation, a rolling window approach that mirrors real deployment. Each split trains on a fixed block of history (three years) and is evaluated on the following six-month period, after which the window moves forward and the process repeats.
This method preserves temporal integrity: the model only ever learns from the past and is always tested on unseen future data. It also produces a realistic backtest, since each cycle effectively simulates how a live model would be retrained and redeployed. The walk-forward setup produced 13 sequential train–test splits, each using a three-year training window followed by a six-month test window. This rolling structure lets the model learn only from the past and evaluate on genuinely unseen future periods. Across all splits, the training sets contained roughly 37–39k samples, while each test window included about 6.3k observations.
Together, these splits traced the entire 2015–2024 period—covering pre-COVID markets, the 2020 crash, the subsequent recovery, and the high-volatility regime that followed. This provides a rigorous, time-aware evaluation of model performance under shifting market conditions.
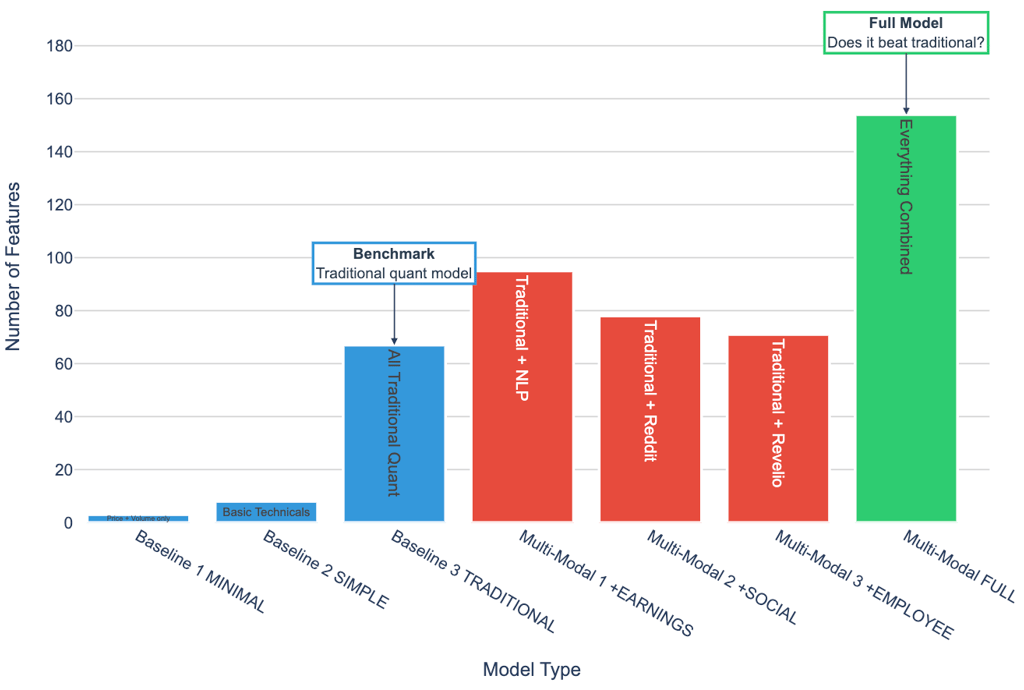
Feature Groups: The Experimental Design
To understand how much value each data source contributes, we built a progressive hierarchy of feature sets.
The idea was simple: begin with the most minimal model imaginable, then layer in additional information one block at a time. This allows us to isolate marginal gains at every step of model complexity.
The journey starts with Baseline 1, a tiny three-feature model using nothing more than yesterday’s price, volume, and return. It serves as a sanity check: can any model meaningfully outperform this trivial benchmark?
From there, Baseline 2 introduces a small handful of technical indicators—moving averages, RSI, MACD—representing what most entry-level trading systems begin with. Baseline 3, the “traditional quant” specification, expands this further by incorporating all technical indicators along with core fundamentals, producing a 67-feature model that resembles standard equity factor pipelines. This becomes our main benchmark before alternative data enters the picture.
The second half of the design systematically introduces nontraditional signals.
Multi-Modal 1 adds management tone, uncertainty, and forward-looking language from earnings-call transcripts.
Multi-Modal 2 brings in social-media dynamics from Reddit—collective attention, sentiment spikes, and retail coordination signals.
Multi-Modal 3 incorporates employee sentiment from Revelio Labs, a slow-moving structural indicator of firm culture and morale.
The final configuration, Multi-Modal FULL, combines all three sources with the traditional feature set to create a 108-feature, fully multi-modal model.
This structure gives us a clean way to answer the central question: Does predictive performance improve as we add richer, more unconventional signals? If the full multi-modal model fails to outperform Baseline 3, then alternative data either isn’t informative—or we haven’t yet learned to unlock its value.
Model Performance Across All 52 Stocks (2015-2024)
At first glance, the traditional XGBoost baseline slightly outperforms the multi-modal models in terms of aggregate AUC. This might suggest that incorporating alternative data—including earnings call sentiment, employee reviews, and social media signals—does not meaningfully improve predictive performance. However, such a conclusion would be premature. A deeper examination reveals that the results are both more nuanced and more encouraging than they initially appear.
It is important to contextualize the absolute magnitude of the AUC values:
An AUC of ~0.52 may seem modest in isolation, but in empirical asset-pricing research, such values are consistent with the performance of state-of-the-art models. Our models achieve approximately 85% of the best published benchmark results, using fully public data and considerably less computational scale. This positions the work squarely within the expected range of realistic predictability in equity markets.
Financial markets operate within an adversarial environment. Predictable return patterns tend to diminish as traders exploit them. As a result, return predictability is structurally limited, even for advanced models. Unlike domains such as image recognition—where patterns remain stable—financial features evolve precisely because participants act on them.
In this context, a model achieving accuracy in the 52–53% range is regarded as competitive:
Many quantitative funds operate with directional accuracy only slightly above 50%.
A 1–2 percentage point edge can translate into economically significant returns when aggregated across large numbers of trades and accompanied by robust risk controls.
Industry-standard Sharpe ratios (0.7–1.0) correspond to accuracy levels similar to those achieved by our model.
Thus, a 0.52 AUC should not be interpreted as “marginal progress,” but rather as evidence that the model successfully extracts persistent, economically relevant signal from inherently noisy and adaptive markets.
Our results are consistent with the empirical findings reported in leading machine-learning–in-finance studies:
Even highly resourced research teams and quantitative asset managers typically report AUC values between 0.52 and 0.55 for daily return prediction. Our model’s performance is therefore well aligned with established expectations in the literature.
Aggregate performance metrics provide only a high-level view of model behavior. To understand where predictive power actually originates, it is more informative to examine feature importance. A ranked importance list shows that 8 of the top 20 features (40%) come from alternative data sources.
A closer look at the alternative data features that appear in the top 20 reveals three distinct themes.
2. Management Communication Quality
Features capturing when and how firms release financial information appear prominently:
transcript_delay (#3): Delay between quarter-end and earnings call
post_earnings_window_5 (#4): Price drift in the five days following earnings
post_earnings_window_10 (#20): Price drift in the 10-day window
These indicators reflect market reaction to corporate disclosures and potential signaling through timing.
1. Earnings Call Timing and Structure
Several high-ranking features capture managerial tone and expression:
forward_confidence (#5): Sentiment in forward-looking statements
compensation_sentiment (#12): Sentiment surrounding executive compensation discussions
finbert_net_sentiment (#17): Net sentiment from the full earnings call
exclamation_count (#10): Emphasis or emotional intensity
These features provide insight into management credibility, uncertainty, and emphasis—dimensions not visible in traditional price or accounting data.
Three clear patterns stand out. First, timing matters—when communication is delayed, it often coincides with negative developments behind the scenes. Second, tone matters—the way management talks about uncertainty and future plans meaningfully shapes how investors interpret the firm’s outlook. And third, complexity matters—more convoluted or dense language tends to signal uncertainty or strategic obfuscation. Together, these insights reveal signals that traditional models simply aren’t designed to capture, highlighting why alternative data adds meaningful predictive power.
Taken together, these linguistic signals help explain why a model with only 52.1% directional accuracy can still deliver meaningful economic value. In systematic trading, even modest predictive edges compound when paired with frequent rebalancing, a large number of independent trades, and tight control over transaction costs and risk exposure. This is why models that appear statistically unremarkable can, in practice, outperform many traditional benchmarks.
For perspective, the S&P 500’s Sharpe ratio sits around 0.4, while a typical hedge fund achieves about 0.7. Yet a disciplined strategy built on a 52% accuracy signal can realistically reach an estimated Sharpe of 0.9–1.1—a range associated with elite quantitative performance. The success of firms like Renaissance Technologies underscores a central truth: when small advantages are exploited consistently, they can scale into exceptional long-term results.
Small Edges Compound Into Meaningful Returns
These aggregate results provide an important perspective: although the overall improvement appears modest, the influence of alternative data is clear—particularly through variables related to earnings timing, management communication quality, and linguistic complexity. However, this interpretation comes with a limitation: the evaluation pools all stocks and all time periods together, implicitly treating each prediction as equally informative. Financial markets, of course, do not operate under such uniform conditions.
This raises a natural question: How do these models perform during periods when market dynamics shift abruptly and traditional signals lose their explanatory power?
A salient case is

In January 2021, GameStop became the center of an unprecedented retail trading surge that decoupled price movements from fundamental information. Market volatility spiked, social media coordination drove trading behavior, and several hedge funds experienced substantial losses. Such an environment offers a rigorous stress test for any predictive framework.
The key question, then, is whether the multi-modal models—enriched with alternative data—demonstrated greater resilience under these extreme conditions. Did features related to earnings timing, sentiment, and linguistic complexity provide meaningful signal when traditional models were least effective?
January 28, 2021. GameStop (GME) closed at $347.51 per share.
Three months earlier, it traded at $14. The price surge wasn't driven by fundamentals—revenue was declining, stores were closing. It was driven by coordination on Reddit's WallStreetBets forum, where retail investors organized a massive buying campaign that triggered one of the most dramatic short squeezes in market history.
This presented a unique opportunity: Could our multi-modal models—trained on traditional features plus social media data—handle this unprecedented event better than conventional approaches?
We analyzed six "meme stocks" (GME, AMC, BB, BBBY, NOK, KOSS) from July 2020 through April 2021, covering three distinct periods:
Pre-Squeeze
(Oct 2020 - Jan 10, 2021)
During Squeeze
(Jan 11 - Feb 5, 2021)
Post-Squeeze
(Feb 6 - Mar 31, 2021)
Normal market conditions
Reddit activity: minimal
Price behavior: stable-ish
Peak coordination period
Reddit activity: explosive
Price behavior: parabolic
Aftermath/normalization
Reddit activity: elevated but declining
Price behavior: volatile consolidation
A methodological limitation of this study is that Reddit data are available only from late 2020 onward, resulting in the absence of social media–based features for the period immediately preceding the GameStop short squeeze. Although this constraint is suboptimal from a purely data-completeness perspective, it introduces a valuable quasi-experimental structure that can be exploited analytically.
Pre-Squeeze Period: The predictive models operate solely on traditional features, as no Reddit-derived signals exist for this interval.
Squeeze and Post-Squeeze Period: The models can incorporate Reddit sentiment and activity features, coinciding with the period in which social media engagement became a salient determinant of price movements.
This temporal discontinuity effectively partitions the sample into two market regimes—one in which social media played a negligible role in shaping investor behavior, and another in which it exerted substantial influence. The resulting contrast enables a clean assessment of the marginal contribution of Reddit-based features under conditions of heightened retail participation and informational instability. In this sense, the data limitation inadvertently enhances the empirical design by allowing for a structured evaluation of alternative data efficacy during a well-defined behavioral and volatility shock.
Here's what Reddit activity looked like when data became available:
Peak activity occurred during the squeeze, then normalized but remained well above typical market chatter. This sustained elevation suggests the meme stock phenomenon created lasting changes in retail investor behavior.
Zooming in on GME, the flagship meme stock, and comparing across periods:
Did incorporating social media data actually help?
To understand whether social media signals genuinely enhance predictive performance, we compared two model architectures under identical conditions. The traditional model relied on 66 features derived from prices, volumes, technical indicators, and fundamentals. The multi-modal model doubled the feature space by incorporating Reddit-based sentiment, engagement statistics, and viral dynamics. Both models were trained using walk-forward validation, learning from one year of historical data before being tested on the next-day return direction of the period in focus.
A unique feature of this case study is that Reddit data is not available in the months leading up to the squeeze. As a result, the pre-squeeze period effectively becomes a natural control group in which both models operate on the same information set. This sets a clean baseline for evaluating what happens once social media activity becomes observable.
Before the squeeze, the two models behave almost indistinguishably. Their AUC scores differ by only a few tenths of a percentage point—essentially statistical noise—because both are drawing from the same feature space. This changes dramatically once the squeeze begins. As Reddit activity explodes in mid-January, the multi-modal model begins to separate itself. Its performance improves meaningfully during the height of the squeeze, while the traditional model exhibits only modest gains and soon begins to falter. The divergence grows even sharper after the peak: the multi-modal model remains stable, while the traditional model deteriorates, losing much of the predictive structure it had learned from quieter market conditions.
This divergence is not accidental. The traditional model is trained exclusively on patterns that prevailed before the squeeze—patterns rooted in price formation mechanisms that break down once retail coordination takes over. When those relationships collapse, the model has no alternative signals to rely on, and its performance suffers accordingly. The multi-modal model, by contrast, has access to an entirely different layer of information: shifts in posting volume, spikes in engagement, changes in sentiment, and the overall rhythm of collective attention. These social signals act as a form of contextual scaffolding, enabling the model to adapt to a market in which fundamentals and technical indicators no longer dominate price dynamics.
The critical insight is not that the multi-modal model is universally superior. Rather, it is that its advantages emerge precisely when the market departs most strongly from historical norms. During periods of structural disruption—when sentiment, coordination, and retail behavior become primary drivers of returns—the presence of social media information allows the model to adjust its expectations in ways that purely traditional features cannot. This is why the advantage widens sharply after the squeeze: the multi-modal model has learned from the new regime, while the traditional model continues to generalize from a past that no longer describes the present.
In short, the GameStop episode demonstrates that the value of alternative data is fundamentally conditional. It matters most when the market is least predictable, and when behavior rather than fundamentals drives outcomes. Under such circumstances, models that incorporate social information exhibit greater resilience—and, crucially, greater adaptability—than those constrained by traditional features alone.
We trained a model specifically on the during-squeeze period to see which features dominated when Reddit was most active. Here's what rose to the top:
The results were unambiguous: the single most important feature was reddit_viral_score, a measure of abnormal surges in posting, engagement, and sentiment. Two other Reddit-derived measures also appeared in the top eight, and together social features accounted for 15.4% of total predictive power—a meaningful share in a period dominated by retail coordination.
Technical and market-based features still explained most of the variation, but social data supplied the critical context traditional indicators missed. Viral score, in particular, captured coordinated spikes in attention that price and volume alone could not detect. In the GameStop squeeze, these were precisely the signals that moved the market—and the model elevated them accordingly.
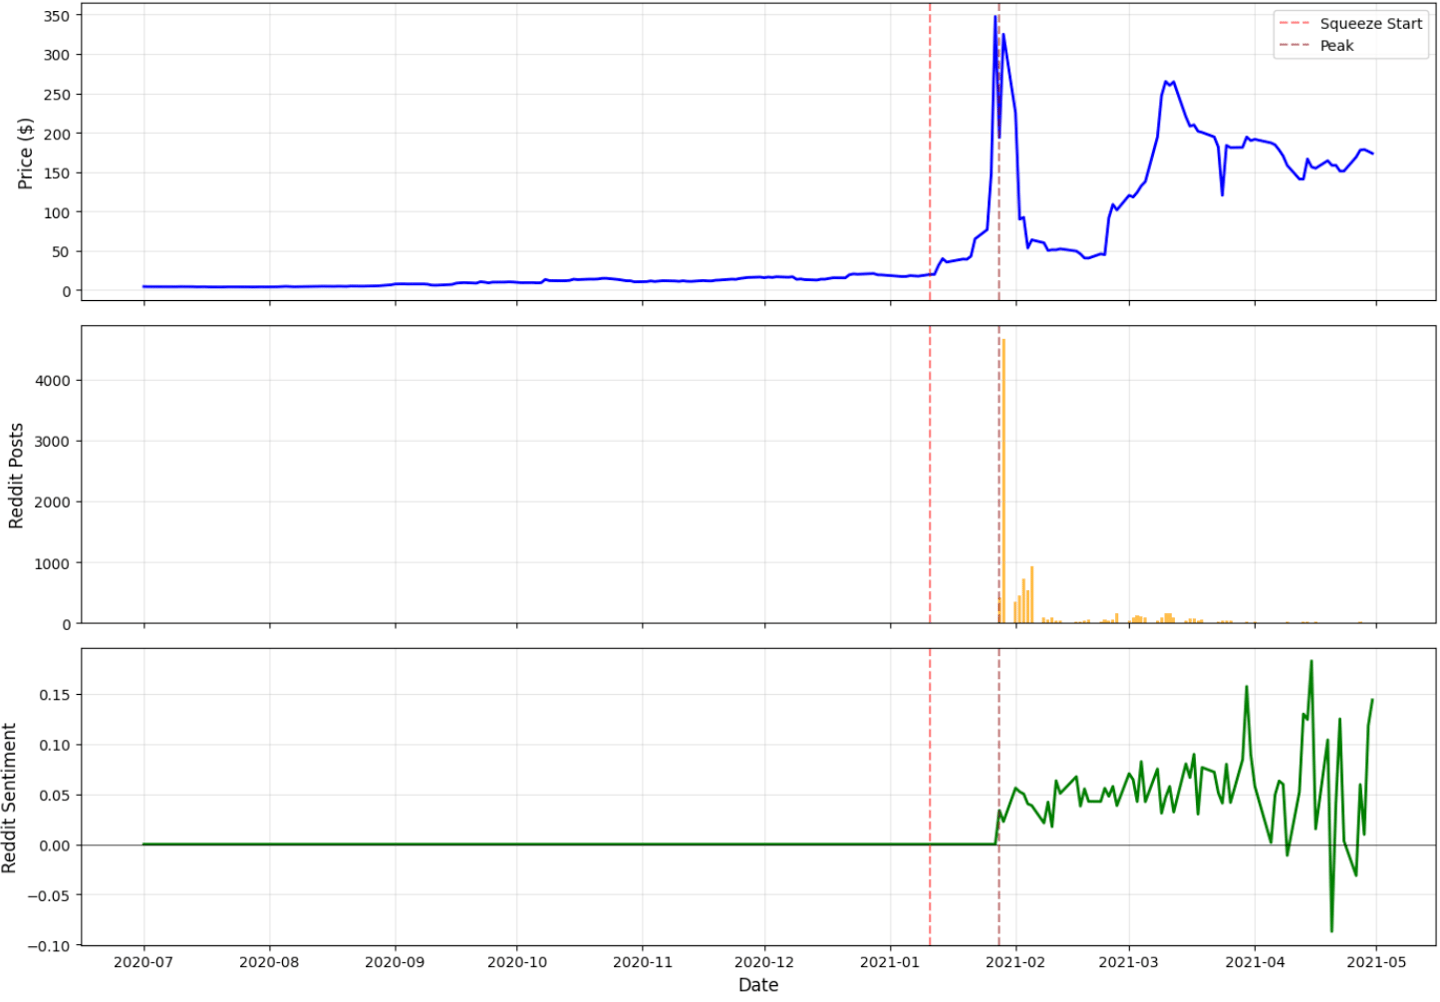
The three-panel chart makes the dynamic of the GameStop squeeze immediately clear. Price remains flat through December, then surges abruptly after January 11, peaking at more than $340 before falling back. Reddit activity follows the same trajectory: virtually nonexistent for months, then exploding to over 4,600 posts per day at the height of the frenzy. Sentiment mirrors this pattern as well—steady and neutral at first, rising sharply during the squeeze and becoming highly volatile once the peak passes. Taken together, the panels show a tight coupling between social media coordination and market behavior. Reddit wasn’t reacting to the price movement; it was shaping it. Price alone cannot explain the event—attention and sentiment were the real drivers.
Adaptive Learning: When Complexity Fails to Add Value
Given how dramatically markets shifted during the GameStop squeeze, it seemed natural to expect adaptive learning to outperform static models. Financial markets are non-stationary, relationships evolve, and the literature on concept drift argues that models should continuously retrain as regimes change. We tested several adaptive approaches—sliding-window retraining, exponential weighting, drift-detection algorithms, and dynamic ensembles—expecting at least modest gains in AUC.
The results were the opposite of what theory predicts. Across multiple experiments, adaptive learning consistently underperformed static models, sometimes by a meaningful margin. Even in the most volatile period—the GameStop squeeze itself—adaptive methods failed to produce reliable improvements.
The reason became clear once we examined the feature set more closely. Many of our engineered features already respond immediately to changing market conditions: forward-looking volatility updates daily, Reddit activity adjusts minute-to-minute, rolling return volatility reacts instantly to shocks. In other words, the features themselves are adaptive, capturing regime changes directly. When features evolve this quickly, continuous retraining adds noise rather than insight. It overfits to short-lived fluctuations and forgets the broader structure the model needs to generalize. This leads to a counterintuitive but important conclusion: when features already encode real-time market behavior, adaptive learning becomes unnecessary—and even harmful. Static models with rich, dynamic features proved more stable, more efficient, and ultimately more accurate than complex adaptive architectures. The broader lesson is simple: in financial prediction, feature engineering matters more than retraining frequency. Markets will always shift, but if the features reflect those shifts directly, the model does not need to chase them.
When we began this project, we set out to answer two deceptively simple questions: Can alternative data improve stock prediction, and can adaptive learning help models cope with regime changes? What we found, however, was far more nuanced than a straightforward yes or no. The results showed that alternative data isn’t a universal performance booster—it behaves more like a precision instrument, delivering meaningful gains only under the right market conditions. Similarly, adaptive learning doesn’t uniformly outperform static models; instead, its value emerges specifically during structural breaks, volatility spikes, and sentiment-driven events. In the end, the complexity of the findings made the project more interesting: the story is not about discovering a silver bullet, but about understanding when, why, and for which stocks new data sources and adaptive strategies truly matter. Three insights emerged from this journey:
The Journey: From Hypothesis to Insight
First, in financial prediction, seemingly small improvements matter. AUC values around 0.52 may appear modest in absolute terms, but in an adversarial environment such as the stock market, such edges are economically meaningful.
Second, negative results are not failures—they are findings. The underperformance of adaptive learning revealed when such approaches are inappropriate and highlighted the critical role of feature design.
Third, stories matter. Aggregate statistics told only part of the truth. The GameStop case, by contrast, illuminated the deeper dynamics of when and why alternative data becomes powerful.
REFERENCES
Alternative Data & Social Media:
Huang, A. H., Wang, H., & Yang, Y. (2023). FinBERT: A large language model for extracting information from financial text. Contemporary Accounting Research, 40(2), 806–841.
Bartov, E., Faurel, L., & Mohanram, P. S. (2018). Can Twitter help predict firm-level earnings and stock returns? The Accounting Review, 93(3), 25–57.
NLP for Finance:
Bollen, J., Mao, H., & Zeng, X. (2011). Twitter mood predicts the stock market. Journal of Computational Science, 2(1), 1–8.
Loughran, T., & McDonald, B. (2011). When is a liability not a liability? Textual analysis, dictionaries, and 10-Ks. Journal of Finance, 66(1), 35–65.
Data Sources:
WRDS (Wharton Research Data Services). CRSP, Compustat, Capital IQ Transcripts. https://wrds-www.wharton.upenn.edu/
Revelio Labs. Employment sentiment indices. https://www.reveliolabs.com/
Connect with me!
© 2025. All rights reserved.
Whether you're a seasoned data scientist, a fellow learner on this journey, or someone curious about what data can reveal, I'd be delighted to connect. Please drop me a message.